One measure of an ecosystem’s breadth is its market penetration. This MetaFAQs splits out the percentage of online adults using major OS families and form factors – such as Windows PCs and iPhones – by country and by age and employment status.
Profile of American game console users
Dan Ness, Principal Analyst, MetaFacts, October 2, 2021
Profile of American game console users
- All online American adults who regularly use a game console
- They number 77 million – 35% of all online American adults
- Profiled by characteristics that are distinctive
- Only profiled by those characteristics which have an index of 80 or below and 120 and above – those which are 20% above or below the average by category
- Expressed as market penetration – the percentage of online adults within each group
- Distinctive characteristics profiles
- Age, age within gender
- Employment status
- Presence of children
- Household size
- Life stage (age, employment status, presence of children)
- Number of home PCs used
- Technology ecosystems
- Characteristics examined and not found to be distinct
- Educational attainment
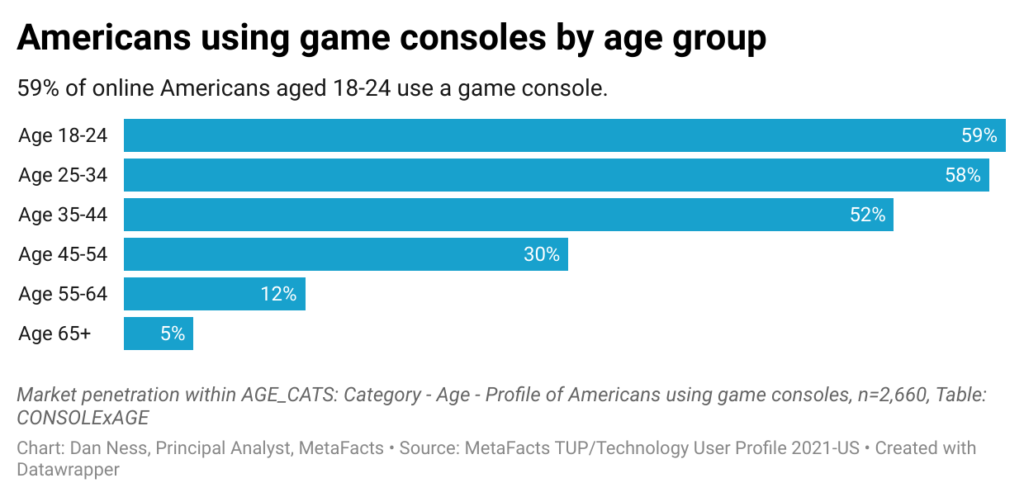
Americans who regularly use a game console by age group
- Game console users skew younger
- Game console use is strongest among the youngest American adults
- Penetration among online Americans aged 18-34 is 58%-59%
- Beyond age 45, the rate drops steeply

Home PC penetration by socioeconomic groups
How different are advantaged from disadvantaged Americans in whether or not they use a home PC? How much has this changed since before the pandemic? How do historically socioeconomically advantaged groups such as high-income or college graduates compare to disadvantaged groups such as single parents, low-income, less-educated, elderly, or people of color? This TUP analysis reports on the penetration of home PCs within each socioeconomic group.
Juggling work and devices to get things done [TUPdate]
During the pandemic, employees have scrambled to be able to work from home, often using their personal devices in lieu of employer-provided technology products. This TUPdate reports on the specific work-related activities regularly done by employees that do and don’t work from home using their smartphones, home PCs, work PCs, and tablets.
Smartphone usage profile [TUPdate]
Smartphones are used differently among younger than older employees as well as adults that are not employed outside the household. This TUPdate reports on each group – their weekly hours used, their unique set of activities, and their differing use of voice assistants.
Profile of home PC users by brand
The major PC makers have attracted very different sets of customers, with some brands being used primarily by younger people and others more like someone’s father’s brand. This MetaFAQs report profiles the users of home PCs by brand and age group, showing the percentage of users in the US as well as collectively across the US, UK, Germany, and Japan.
PC penetration by socioeconomic groups
How different are advantaged from disadvantaged Americans in whether or not they use a PC, whether personally owned, employer-provided, for self-employment, school, or another one? How much has this changed since before the pandemic? How do historically socioeconomically advantaged groups such as high-income or college graduates compare to disadvantaged groups such as single parents, low-income, less-educated, elderly, or people of color? This TUP analysis reports on the penetration of PCs within each socioeconomic group.
American smartphone carrier brands [MetaFAQs]
Three carrier brands dominate American smartphone users. This MetaFAQs reports on the current share of smartphone brands actively used by online American adults.
Smartphone brand share by country [MetaFAQs]
The market share of actively used smartphones varies substantially by country. Apple leads where Samsung or Huawei don’t, and vice versa. This MetaFAQs reports on the share of active installed based on online adults in the US, Germany, UK, Japan, and China’s most-educated adults.
Smartwatch purchase plans
Among online Americans, purchase intentions for Apple Watches outpace those for Android Smartwatches.

