

VR headsets have received recent attention again after more than a decade of on-again/off-again experimentation with limited market acceptance. While the overall penetration rate of actively-used VR headsets has reached 5% for the first time in 2021, usage rates vary considerably across socioeconomic groups. Having the means to acquire all that’s needed to fully enjoy VR headsets isn’t the only factor affecting adoption as even some upper-income groups are only nominally further ahead than other less advantaged groups. The groups being reported consider age group, employment status, household size, ethnicity, presence of children, educational attainment, and other socioeconomic factors.
User profile by operating system ecosystem
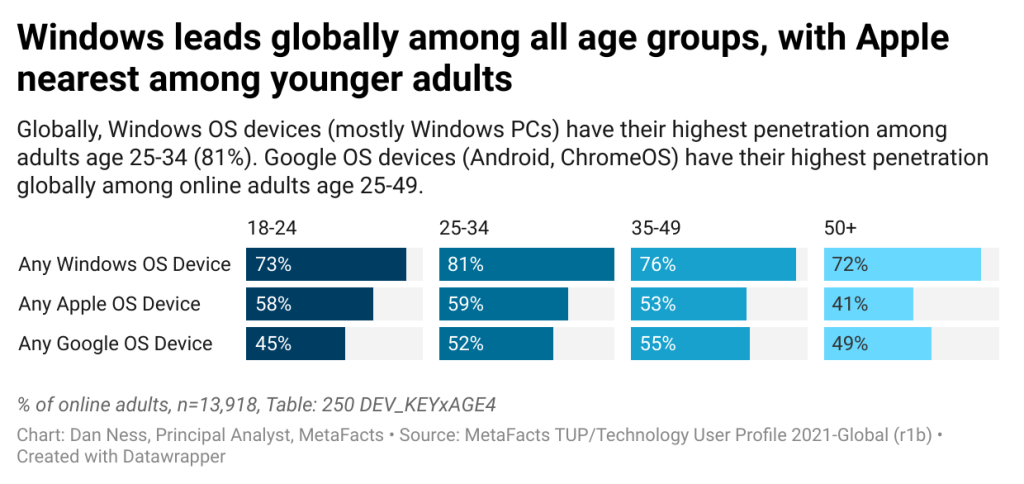
Dan Ness, Principal Analyst, MetaFacts, October 13, 2021
Apple for youngest adults and Windows for the middle
- Windows has the broadest overall market penetration of any OS family
- Globally, Windows is strongest among adults who are employed, in larger households, working from home, and neither the oldest nor youngest
- Apple OS devices have their strongest market penetration among younger adults, especially those employed and working from home
- Apple’s global market penetration is supported in three ways: iPhones, Macs, and iPads
- The global penetration of Google OS devices is primarily supported by Android smartphones.
User profile by technology ecosystem
The major technology ecosystems have each captured different market segments. This TUP MetaFAQs report details the current market penetration of Windows, Apple OS devices, and Google OS devices by age group, and work-from-home status within the US and across the US, UK, Germany, and Japan.
Samsung user profile [MetaFAQs]
Samsung’s share of the installed base varies by country and within user age groups. This MetaFAQs reports on Samsung’s share by country, age group, and employment status.
Technology ecosystem device penetration by country, age, and employment status
One measure of an ecosystem’s breadth is its market penetration. This MetaFAQs splits out the percentage of online adults using major OS families and form factors – such as Windows PCs and iPhones – by country and by age and employment status.
Home printer use among socioeconomic groups
Among socioeconomically advantaged groups of American online adults, the use of home printers has grown between 2018 and 2021. Nationwide, however, and especially among disadvantaged groups, home printer use has declined. This MetaFAQs reports on the active use of home printers by American socioeconomic groups. The groups being reported consider age group, employment status, household size, ethnicity, presence of children, educational attainment, and other socioeconomic factors.
Top activities across platforms [TUPdate]
There are certain activities that transcend form factors, such that they are popular with every type. This TUPdate identifies regular activities that are high on the list for smartphones, PCs, and tablets, those popular on two of the three, or unique to one type.
Windows leads what Apple and Google divide [MetaFAQs]
Windows, Apple, and Google (Android, Chromebook) are each stronger or weaker by form factor and country. This MetaFAQs reports on the share of each OS ecosystem by country and within the US, by age group.
Home PC penetration by socioeconomic groups
How different are advantaged from disadvantaged Americans in whether or not they use a home PC? How much has this changed since before the pandemic? How do historically socioeconomically advantaged groups such as high-income or college graduates compare to disadvantaged groups such as single parents, low-income, less-educated, elderly, or people of color? This TUP analysis reports on the penetration of home PCs within each socioeconomic group.
Top smartphone activities [TUPdate]
What we do defines us more than what we are carrying. This MetaFAQs profiles smartphone users by their regular activities – those which are most popular worldwide and those unique to the country. It further splits out activities into four groups: younger and older adults that are employed versus those who are not employed outside the home.