

HP has the preeminent market position in home printers. HP home printers are being used by 27% of online Americans. This MetaFAQs profiles users of HP home printers by several critical demographic and behavioral factors distinctive from the average American online adult: age, age within gender, employment status, and life stage.
Profile of Americans using HP computers
21% of all online American adults regularly use an HP computer. Although not dominating the market, HP computer customers still make a significant dent in the industry. The average age of American HP computer users skews toward older men.
This MetaFAQs reports on the percentage of online Americans who regularly use an HP PC by age group, age and gender, employment status, life stage, and technology ecosystem.
Mobile Phones TUP Lens
Smartphones have rapidly, although not completely, replaced feature phones. Smartphone users have expanded their range of activities with new uses while also increasingly migrating activities from computers and tablets. This TUP Highlights Report profiles smartphones – their market penetration, user demographic profile, regular activities, usage profile, key competitors, and purchase plans.
This TUP Highlights report includes the following sections: penetration of smartphones versus feature phones, smartphone brand share, top activities for smartphones, smartphone carrier share, smartphone usage profile, trends in technology ecosystems, major activities for a market segment, and the profile of smartphone users.
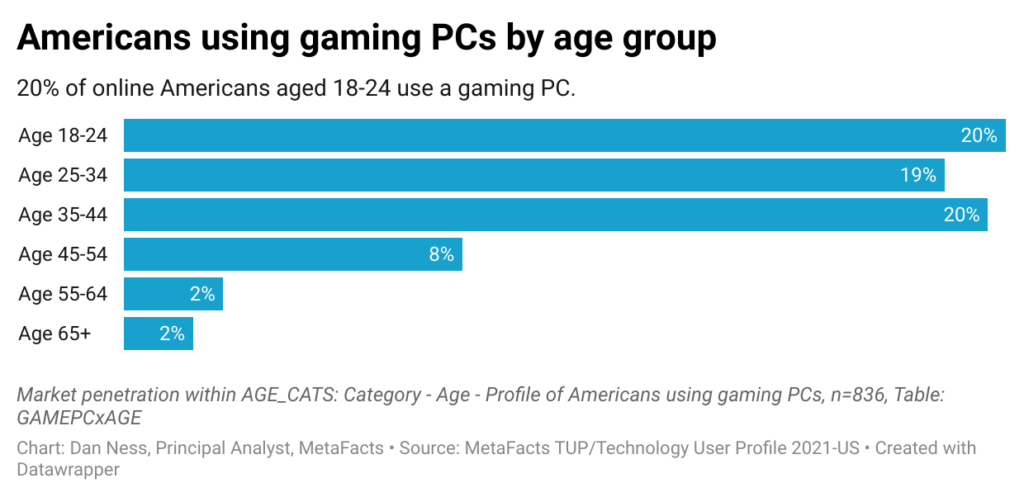
Profile of Americans using gaming PCs
Dan Ness, Principal Analyst, MetaFacts, October 9, 2021
Profile of Americans using gaming PCs
- All online American adults who regularly use a gaming PC
- They number 25.3 million – 12% of all online American adults
- Defined as using a “Gaming desktop or gaming notebook – designed for playing video games, such as with special video cards and extra memory”
- Profiled by characteristics that are distinctive
- Only profiled by those characteristics which have an index of 80 or below and 120 and above – those which are 20% above or below the average by category
- Expressed as market penetration – the percentage of online adults within each group
- Distinctive characteristics profiles
- Age, gender, age within gender
- Employment status
- Presence of children
- Household size
- Life stage (age, employment status, presence of children)
- Number of home PCs used
- Technology ecosystems
- Characteristics examined and not found to be distinct
- Educational attainment
Americans who regularly use a gaming PC by age group
- Gaming PC users skew younger
- Game console use is strongest among the youngest American adults – aged 18-44
- Penetration among online Americans aged 18-44 is 19%-20%
- Beyond age 45, the rate drops steeply
Home printer use among socioeconomic groups
Among socioeconomically advantaged groups of American online adults, the use of home printers has grown between 2018 and 2021. Nationwide, however, and especially among disadvantaged groups, home printer use has declined. This MetaFAQs reports on the active use of home printers by American socioeconomic groups. The groups being reported consider age group, employment status, household size, ethnicity, presence of children, educational attainment, and other socioeconomic factors.
Home PC penetration by socioeconomic groups
How different are advantaged from disadvantaged Americans in whether or not they use a home PC? How much has this changed since before the pandemic? How do historically socioeconomically advantaged groups such as high-income or college graduates compare to disadvantaged groups such as single parents, low-income, less-educated, elderly, or people of color? This TUP analysis reports on the penetration of home PCs within each socioeconomic group.
Profile of home PC users by brand
The major PC makers have attracted very different sets of customers, with some brands being used primarily by younger people and others more like someone’s father’s brand. This MetaFAQs report profiles the users of home PCs by brand and age group, showing the percentage of users in the US as well as collectively across the US, UK, Germany, and Japan.
PC penetration by socioeconomic groups
How different are advantaged from disadvantaged Americans in whether or not they use a PC, whether personally owned, employer-provided, for self-employment, school, or another one? How much has this changed since before the pandemic? How do historically socioeconomically advantaged groups such as high-income or college graduates compare to disadvantaged groups such as single parents, low-income, less-educated, elderly, or people of color? This TUP analysis reports on the penetration of PCs within each socioeconomic group.
Dominant tech device brands [MetaFAQs]
Apple dominates most users around the world and especially in the US. However, its expansion has flattened while computer leaders Dell and HP have had their market penetration contract. Number two Samsung, having experienced modest gains in the first year of the pandemic, has since declined in part due to withering user demand, supply chain issues, and competitive pressures.
This TUPdate reports on the percentage of online Americans who are using at least one of a market leader’s products: Apple, Samsung, Dell, HP, Sony, Lenovo, Acer, ASUS, and Huawei.
Highlights: Printers
Who’s printing—and what are they printing? TUP Highlights include a broad and deep dive into an essential technology usage topic.
This highlights report focuses on printers, including: top printer brands, purchase plans for printers, top printing activities, profile of intensive printer users, ink use, trends in printing, major activities for a market segment, top printer form factors, and profile of printer user by activity. The research results showcase the TUP/Technology User Profile study, MetaFacts’ survey of a representative sample of online adults profiling the full market’s use of technology products and services during the wave of TUP/Technology User Profile 2021, which is TUP’s 39th annual. TUP Highlights typically also include results from previous waves of TUP.