

Smartphones have rapidly, although not completely, replaced feature phones. Smartphone users have expanded their range of activities with new uses while also increasingly migrating activities from computers and tablets. This TUP Highlights Report profiles smartphones – their market penetration, user demographic profile, regular activities, usage profile, key competitors, and purchase plans.
This TUP Highlights report includes the following sections: penetration of smartphones versus feature phones, smartphone brand share, top activities for smartphones, smartphone carrier share, smartphone usage profile, trends in technology ecosystems, major activities for a market segment, and the profile of smartphone users.
Virtual reality headset use among socioeconomic groups
VR headsets have received recent attention again after more than a decade of on-again/off-again experimentation with limited market acceptance. While the overall penetration rate of actively-used VR headsets has reached 5% for the first time in 2021, usage rates vary considerably across socioeconomic groups. Having the means to acquire all that’s needed to fully enjoy VR headsets isn’t the only factor affecting adoption as even some upper-income groups are only nominally further ahead than other less advantaged groups. The groups being reported consider age group, employment status, household size, ethnicity, presence of children, educational attainment, and other socioeconomic factors.
Profile of American game console users
Dan Ness, Principal Analyst, MetaFacts, October 2, 2021
Profile of American game console users
- All online American adults who regularly use a game console
- They number 77 million – 35% of all online American adults
- Profiled by characteristics that are distinctive
- Only profiled by those characteristics which have an index of 80 or below and 120 and above – those which are 20% above or below the average by category
- Expressed as market penetration – the percentage of online adults within each group
- Distinctive characteristics profiles
- Age, age within gender
- Employment status
- Presence of children
- Household size
- Life stage (age, employment status, presence of children)
- Number of home PCs used
- Technology ecosystems
- Characteristics examined and not found to be distinct
- Educational attainment
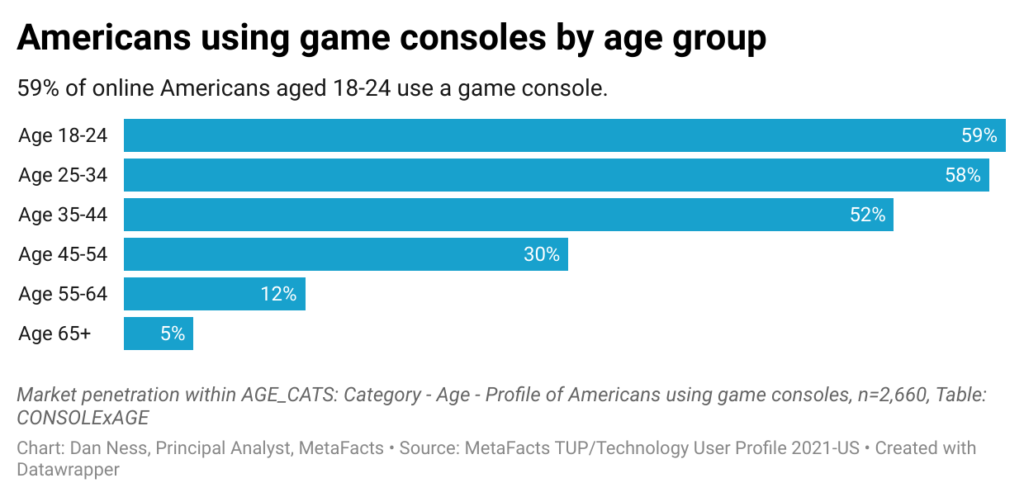
Americans who regularly use a game console by age group
- Game console users skew younger
- Game console use is strongest among the youngest American adults
- Penetration among online Americans aged 18-34 is 58%-59%
- Beyond age 45, the rate drops steeply
Brand footprints and ecosystems – market progress update [TUPdate]
Popularity may not matter much in life—but when it comes to device and ecosystem adoption—it can mean quite a lot.
This TUPdate measures brand footprint and ecosystem adoption by how many people are using its devices. Microsoft Windows ranks as the most successful technology ecosystem, while Google’s Android and ChromeOS devices, Facebook, Amazon, Apple’s ecosystem, and HP’s brand footprint also hold substantial penetration rates. This TUPdate reports on the progress of seven top ecosystems and brands in reaching market penetration using the wave of research from TUP/Technology User Profile 2020 across the US, Germany, the UK, Japan, China, and India.
Ecosystem combination concentration by country [MetaFAQs]
It may seem like a jungle out there, but each ecosystem has one dominant product type and at least one other product or combination of products making up its market base. So, which ecosystems have the most multi-product combinations?
This MetaFAQs reports on the concentration of products within the bases of Microsoft Windows and Xbox, Facebook networks or Portals, HP PCs or printers, Amazon shoppers and Alexa users, Apple iPhones, iPads, Watches, and Macs, Google Android/ChromeOS smartphones and tablets, and Samsung smartphones, PCs, and tablets. This report measures online adults in the US, Germany, the UK, Japan, China, and India from TUP/Technology User Profile 2020, which is TUP’s 38th annual.
Highest ecosystem combinations [MetaFAQs]
Which tech ecosystems have the most dedicated customers? Many tech ecosystems have customers who use multiple products from that ecosystem. Some adults use two or more Windows PCs, or an Apple iPhone and an iPad, for example.
This MetaFAQs reports on the concentration of same-family combinations of products among online adults using: Microsoft Windows and Xbox, Facebook networks or Portals, HP PCs or printers, Amazon shoppers and Alexa users, Apple iPhones, iPads, Watches, and Macs, Google Android/ChromeOS smartphones and tablets, and Samsung smartphones, PCs, and tablets. This report measures online adults in the US, Germany, the UK, Japan, China, and India from TUP/Technology User Profile 2020, which is TUP’s 38th annual.
Low scores – the decline of game-playing by Americans [MetaFAQs]
Americans use various connected devices to play games—but not as much as they used to. Since 2016, fewer Americans regularly play an immersive or other game with each passing year.
This MetaFAQs reports the trend in active use by online Americans by platform – game consoles, smartphones, PCs, and tablets – from 2016 through 2020. The research results showcase the TUP/Technology User Profile study, MetaFacts’ survey of a representative sample of online American adults profiling the full market’s use of technology products and services. The current wave of TUP is TUP/Technology User Profile 2020, which is TUP’s 38th annual.
Highest ecosystem combinations [MetaFAQs]
Which tech ecosystems are strongest? One measure of ecosystem strength depends on how many products online adults use within that system. While Microsoft and Facebook take the lead in many countries, that is not always the case.
This MetaFAQs reports on the use of two or more products or services by online adults spanning: Microsoft Windows and Xbox, Facebook networks or Portals, HP PCs or printers, Amazon shoppers and Alexa users, Apple iPhones, iPads, Watches, and Macs, Google Android/Chrome smartphones and tablets, and Samsung smartphones, PCs, and tablets. This report measures online adults in the US, Germany, the UK, Japan, China, and India from TUP/Technology User Profile 2020, which is TUP’s 38th annual.
Samsung and Apple users by age group and country [MetaFAQs]
Age may be just a number, but a user’s age can tell us a lot about their preferences—especially between top competitors Samsung and Apple. Since each company is striving to expand its core base beyond smartphones to more PCs/Macs and tablets, it’s worth noting that there is a distinct difference in market penetration by age group.
This MetaFAQs details the device-type penetration of Samsung and Apple’s smartphones, PCs, and tablets by age group in 2020 in the US, UK, Germany, and China.
Samsung and Apple’s device type penetration within core [MetaFAQs]
The competition is fierce between Samsung and Apple. Both companies have the strongest hold of the smartphone market, and they are now trying to expand this across device types—especially within their pre-existing core customer base. One measure of brand loyalty is the range of device types that customers actively use.
This MetaFAQs details the device-type penetration of Samsung and Apple’s smartphones, PCs, and tablets within each of their respective core bases in 2020 in the US, UK, Germany, and China.