

There has been a sea change in which connected devices people use as well as how they use them. This TUP Highlights report details the trends in device ownership, the shifts between technology ecosystems, and market penetration levels. It spells out the major activities for each type of device, and how usage has changed. Furthermore, it details how many employees use personal devices for remote work.
Smart speakers among young and old
How deeply have smart speakers penetrated technology users’ lives? From 2019 to 2021, has market penetration shifted very much? Which age group has adopted smart speakers more quickly and deeply than others? How different is this in the US than in the UK or Germany or Japan? This TUP analysis reports on the percentage of online adults that actively use a smart speaker.
Breadth of voice assistant usage
Dan Ness, Principal Analyst, MetaFacts, December 13, 2021
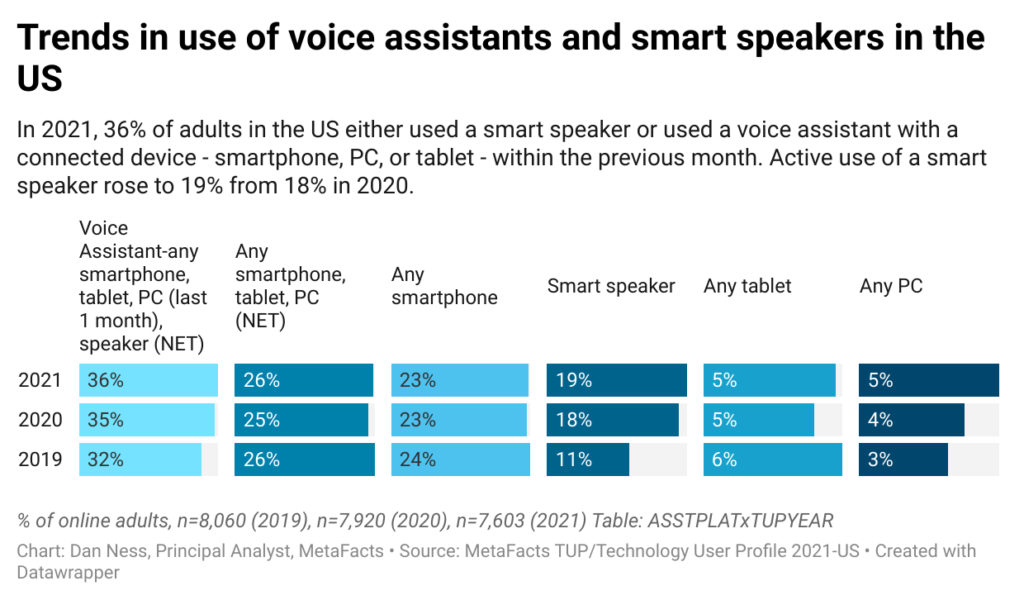
Actively using a voice assistant or smart speaker
- This analysis focuses on those people who are actively using a voice assistant or smart speaker
- Have used a connected device to use a voice assistant within the previous month
- Smartphone, PC, or tablet
- Have a smart speaker
- Have used a connected device to use a voice assistant within the previous month
- Base: all online adults
Active voice assistant usage by platform – US
- The overall use of a voice assistant or smart speaker has only slightly increased between 2019 and 2021
- Smart speaker usage has grown the most among American online adults, rising from 11% in 2019 to 19% in 2021
- Voice assistant usage with other connected devices has not changed markedly
- Voice assistant usage with a smartphone continues to outpace smart speaker use
Average number of tablets being used among socioeconomic groups
How different are advantaged from disadvantaged Americans in how many tablets they use? How much has this changed since before the pandemic? How do historically socioeconomically advantaged groups such as high-income or college graduates compare to disadvantaged groups such as single parents, low-income, lesser-educated, elderly, or ethnic groups? This TUP analysis reports on the number of tablets actively used within each socioeconomic group.
Smartphone penetration by socioeconomic groups
How different are advantaged from disadvantaged Americans in whether or not they use a smartphone? How much has this changed since before the pandemic? How do historically socioeconomically advantaged groups such as high-income or college graduates compare to disadvantaged groups such as single parents, low-income, less-educated, elderly, or people of color? This TUP analysis reports on the penetration of smartphones within each socioeconomic group.
Trends in technology ecosystems
Among online Americans, Smartphones have reached the same penetration rate as PCs, partly due to some segments where PC usage has declined. Apple has propelled much of this growth, outpacing Android smartphones in nearly every segment. Windows PCs, while still dominant, have been gradually losing their lead and penetration rates among most segments. Usage of tablets has continued its slow decline, primarily due to lowered market penetration of iPads within most market segments.
Profile of Americans playing games using a connected device
Game-playing is more widespread than many people realize; a regular activity of 128.8 million online Americans. Those who only follow game consoles may not realize the extent of game-playing extending to smartphones, PCs, and tablets. Game-playing is an everyday activity for 59% of online Americans. This MetaFAQs profiles the group of game-players using connected devices, detailing the critical demographic and behavioral factors distinctive from the average American online adult: age, age within gender, employment status, household size, and life stage.
Profile of American tablet game players
For most Americans, tablets are used for passive activities, from watching videos to web browsing. Game-playing is a regular activity for many. This MetaFAQs profiles the group of tablet game-players, representing 11% of online Americans, detailing the critical demographic and behavioral factors distinctive from the average American online adult: age, gender, age within gender, life stage, and number of PCs used.
Mobile Phones TUP Lens
Smartphones have rapidly, although not completely, replaced feature phones. Smartphone users have expanded their range of activities with new uses while also increasingly migrating activities from computers and tablets. This TUP Highlights Report profiles smartphones – their market penetration, user demographic profile, regular activities, usage profile, key competitors, and purchase plans.
This TUP Highlights report includes the following sections: penetration of smartphones versus feature phones, smartphone brand share, top activities for smartphones, smartphone carrier share, smartphone usage profile, trends in technology ecosystems, major activities for a market segment, and the profile of smartphone users.
Samsung user profile [MetaFAQs]
Samsung’s share of the installed base varies by country and within user age groups. This MetaFAQs reports on Samsung’s share by country, age group, and employment status.