Around the world, tech users are listening—to their devices, at least. Smartphones dominate listening activities, but many other devices, like PCs and tablets, also play a role. This MetaFAQs profiles all online adults who actively use their connected devices for specific listening & hearing activities. The report details which activities are being done by platform, showing how computers are used differently from smartphones or tablets. Active listeners number 209 million in the US (95% of online American adults), 54.6 million in Germany (94%), 44.2 million in the UK (94%), and 78.1 million in Japan (87%). Report [TUP_doc_2022_0129_list] in TUP Lenses: Consumer Electronics; Activities; Wearables, Hearables, Listening, and Speaking; Home Entertainment.
What are the major listening activities across countries?
Who’s listening? And to what? Most online adults report having used any connected device for specific listening and hearing activities within the previous month (ranging from 87-95% of online adults, depending on country). Regularly making personal phone calls dominates as the most popular listening activity in every country surveyed, and video calls have reached the halfway mark.
This MetaFAQs reports on listening activities (including phone calls, videos/movies, video calls, music/radio/podcasts, television, video games, video meetings, voice assistants, and voice memos) by country: the US, UK, Germany, and Japan in 2021.
Profile of voice assistant users
Using our voice offers the chance to get things done without typing when using a smart speaker or another connected device – smartphone, PC, or tablet. However, current usage has not reached even half of the population. This MetaFAQs reports on the percentage of online adults in the US, Germany, UK, and Japan that regularly use a voice assistant or smart speaker, detailed by age group.
Game console use among socioeconomic groups
Just over one-third of online American adults regularly use a game console. Penetration rates vary widely between socioeconomic groups, with American IT employees having some of the highest rates and seniors aged 75 and higher having some of the lowest. This MetaFAQs reports on the penetration of game consoles by major socioeconomically advantaged and disadvantaged groups.
Highlights: Devices
There has been a sea change in which connected devices people use as well as how they use them. This TUP Highlights report details the trends in device ownership, the shifts between technology ecosystems, and market penetration levels. It spells out the major activities for each type of device, and how usage has changed. Furthermore, it details how many employees use personal devices for remote work.
Smart speakers among young and old
How deeply have smart speakers penetrated technology users’ lives? From 2019 to 2021, has market penetration shifted very much? Which age group has adopted smart speakers more quickly and deeply than others? How different is this in the US than in the UK or Germany or Japan? This TUP analysis reports on the percentage of online adults that actively use a smart speaker.
Breadth of voice assistant usage
Dan Ness, Principal Analyst, MetaFacts, December 13, 2021
Actively using a voice assistant or smart speaker
- This analysis focuses on those people who are actively using a voice assistant or smart speaker
- Have used a connected device to use a voice assistant within the previous month
- Smartphone, PC, or tablet
- Have a smart speaker
- Have used a connected device to use a voice assistant within the previous month
- Base: all online adults
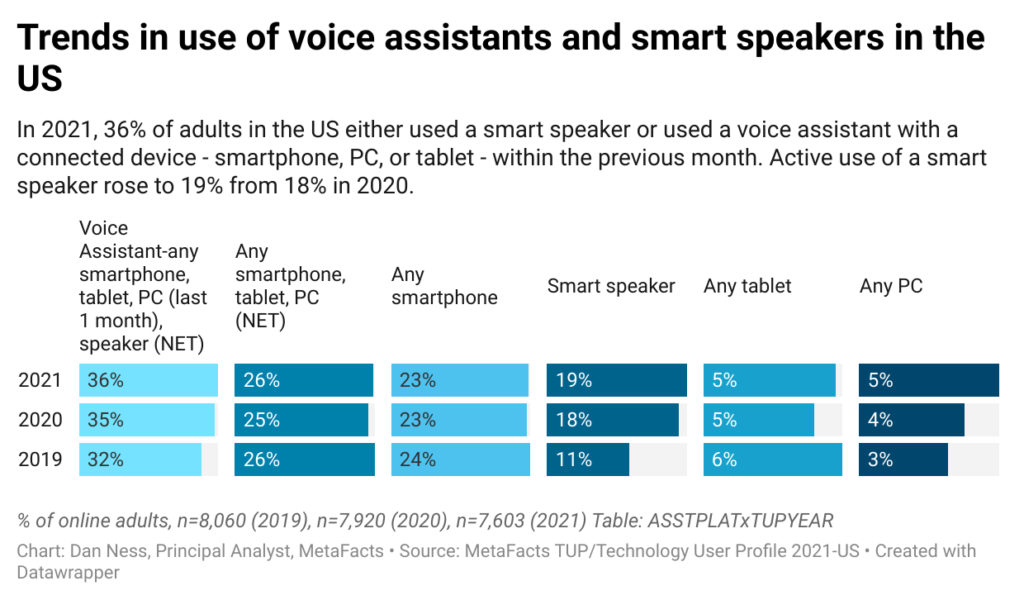
Active voice assistant usage by platform – US
- The overall use of a voice assistant or smart speaker has only slightly increased between 2019 and 2021
- Smart speaker usage has grown the most among American online adults, rising from 11% in 2019 to 19% in 2021
- Voice assistant usage with other connected devices has not changed markedly
- Voice assistant usage with a smartphone continues to outpace smart speaker use

On-device video and movie watching among socioeconomic groups
Smartphones, tablets, and PCs are increasingly used to watch movies and videos. However, it is a regressive activity, being done more often among socioeconomically disadvantaged than advantaged groups. This MetaFAQs reports on the share of Americans regularly using their connected devices to watch movies and videos both before the pandemic (TUP 2019) and through 2021. The groups being reported consider age group, employment status, household size, ethnicity, presence of children, educational attainment, and other socioeconomic factors.
Paid streaming music listening among socioeconomic groups
Listening to paid streaming music grew markedly among Americans, rising from 29% of online Americans in 2019 prior to the pandemic and reaching 36% in 2021. This MetaFAQs reports on the percentage of Americans regularly using their connected devices for paid streaming music by socioeconomic group. The groups being reported consider age group, employment status, household size, ethnicity, presence of children, educational attainment, and other socioeconomic factors.
Technology use among American IT employees
Do American IT employees lead the way in technology, at least with the tech products and services they use? This TUPdate reports on this socioeconomically and technologically advantaged group, contrasting them with the disadvantaged. The TUP results identify the penetration of device form factors within this group and other groups, as well as the number of connected devices they use, the hours they use them, and their work from home status. This TUPdate also identifies the activities this group does with their devices that is uniquely different from other advantaged, disadvantaged, and average Americans, as well as their active collection of consumer electronics and purchase plans.

